Here’s what I’m seeing from 2018 in San Diego real estate, along with predictions for 2019…. Always hand-written with stats direct from our local MLS. First the Q4 Summary, and then bigger / yearly trends next.
2018 Q4 Summary
Sales Volume Down: Down 19% from Q3 2018. Down 16% from Q4 2017
Inventory (Seasonally) Up: Down 26% from end of Q3 2018. Up 37% from Q4 2017
Loan Rates Down: Started at 4.81%, Went up, then Down to end at 4.61%
Home Values Up/Down: Down 1-2% in Q4. Median sales price up ~ 3-4% over Q4 2017
Govt./Policy Changes: Trade War, Govt Shutdown & Fed Fund Rate
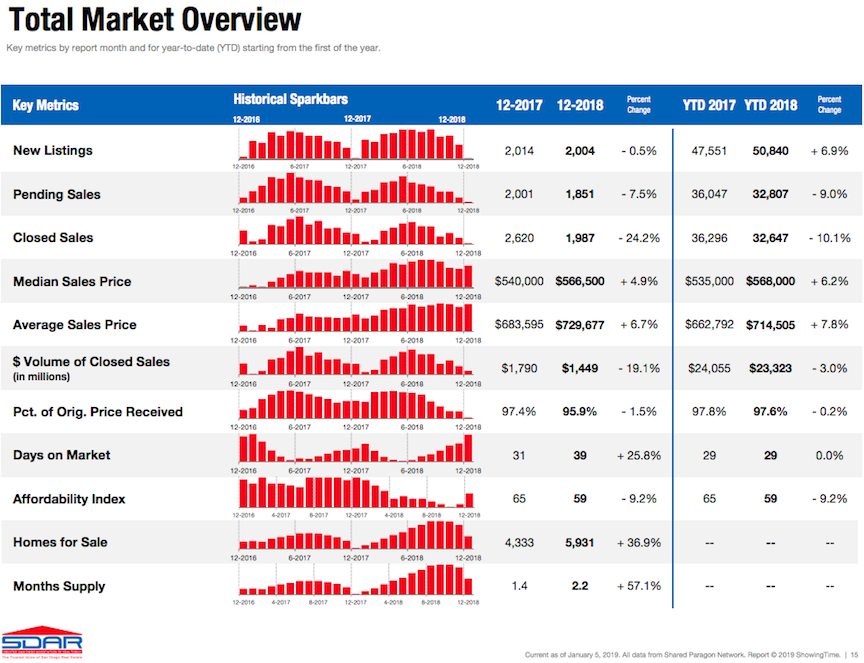
The Above image is a visual summary of my statistics reference from our local San Diego Association of Realtors.
Click here to View Full Stats from San Diego Association of Realtors
2018 – The Details
Sales Volume:
Sales Volume (# of total sales) has been going down for 3-4 years, but so has total inventory. Thus prices continued to go up as the supply/demand curve was pointing up. Sales Volume peaked in June and was dropping all of Q3 with a big drop-off that started at the end of the 3rd quarter and continued through the 4th. With rates rising all year, it’s no surprise that sales went down as rates were peaking in early 4th quarter, likely due to a lack of affordability.
But contrary to the last few years, the end of the year saw a noticeable drop in home loan rates, which seems to have shocked the holiday market into action.
While it’s normal for Q4 sales to drop, there is a bigger trend at work when we see that Q3 2018 had 16% less sales than 2017, despite having more inventory to choose from.
Inventory:
Inventory was on the rise all year until late August when it flattened out for a couple months and then started dropping in late October. Inventory dipped quite a bit in December, but the inventory peak was so late this year that it’s clear the market shifted and we do have more choices for buyers on market.
Total Inventory is up as a result of more new listings than last year, as well as fewer sales. New listings were up 6.9% total in 2018 over 2017.
The inventory shift is much more noticeable in the attached housing section this year. In comparing new listings in 2018 compared to 2017, Detached homes are up 6.1% and Attached Condos are up 8.7%.
All that said, we need to remember that inventory is still near all-time lows (achieved a year ago) and a shift towards more inventory is a good thing. But will inventory continue to rise as a trend or level off? Currently, we still have year-over-year pricing gains of about 3-4%, so there has been enough demand this year to keep pushing prices up overall.
Loan Rates:
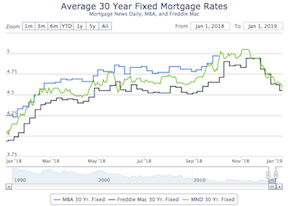
Rates started the year at 4.05% (MND average on 30-year fixed), steadily climbed in Q1 and edged slowly up to a peak in early November of 5.05%. This full 20-25% rise in rates was primarily, IMO, responsible for the market shift we saw this year. With home prices being flat, a rise in rates like that lowers affordability to consumers by 20% in terms of their monthly expenses.
In contrast to the first 10 months, rates started dropping precipitously in early November. It’s been moving with the stock market down as investors pull money from short-term investments (stocks) and invest in long-term safer investments (bonds & home loans), therefore lowering rates due to more money in the market for loans. Rates are currently at about 4.5%. We’ve seen an oddly strong pick-up in the market over the holidays, which I also attribute primarily to the rates dropping, but also to home prices dropping a bit, too. Lower rates and lower prices work together to raise affordability for buyers. While affordability went up in Q4, we still ended the year down 7% from one year ago.
Most lenders I’m speaking with are highly uncertain of where rates will go in the very near future but most think rates will creep back up over 5% by the end of the year. I think a lot of the temporary fluctuations will depend on stability in Washington, the stock market, and/or trade war with China.
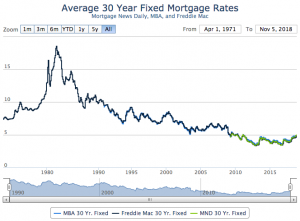
Home loan rate charts:
Long Term Rate Chart: 1971 – 2018 Short Term Rate Chart: 2018

Govt / Policy Changes:
The fed raised the Federal Funds Rate 3 times in 2017. This year, they raised it 4 times (each time raising it .25). The previous expectation was that the fed would raise rates 3 more times in 2019, but recent news reports say they are likely to be a little more conservative with rate hikes and maybe do just 1 in 2019. These hikes raise the cost of money overall in the market and fight against inflation. They don’t directly effect fixed mortgages, but they directly effect ARM’s, equity lines and anything with an adjustable rate. On the positive side, rate hikes are a sign of the Fed’s confidence in our economy.
Tax reform still has a lot of people speculating, but very soon they will know how they fared under the new system. In San Diego, various pockets/price-points were effected more than others. Most working property owners in Coastal San Diego are likely to take a hit from the SALT tax $10k cap but many of those people will also show a direct benefit from the corporate tax cut, lower income tax rates, child tax credits, etc. I myself expect a tax cut due to the 20% corporate tax cut on pass-through income.
The trade war with China is also a big X factor that I’m not really qualified to comment on with confidence, but I know it’s effecting our economy when companies like Apple take a massive daily tumble on wall street and blame it on these new tariffs and the uncertainty of a trade war. That said, when stocks tumble, so do home loan rates making homes more affordable.
Home Values:
We started 2018 out fairly slow, but the spring selling season kicked in in March and we were seeing Median prices of 5-10% over the same month from the year prior all the way through summer. However, as the year went on, sales slowed, inventory rose and subsequently, home values stopped rising in Q3 and dipped in Q4. By the end of the year, Median home values were just about 3-4% over the year prior. Uncharacteristically, December prices were up a tick, but given the rate drop, it’s not too hard to see why.
What does the future hold? My predictions are below…
What’s next?:
It is my belief that the market is going through a peak with seasonal variations that will last a couple years. We may see temporary market fluctuations as reactions to global/national events. I believe we are finishing a mini-correction brought upon by a quick rise in interest rates coupled with diminishing affordability, and a cooling national economy. While prices are still up, we see a slight shift has happened this year towards opposing trends of higher inventory, less sales/demand, and more new listings. Months Supply of Inventory is the best measure of supply/demand and that’s up from 1.4 months to 2.2 months, or 57.1%. That said, the most recent data is actually showing a heating up of the market, perhaps a result of dropping rates / prices and some pent up demand.
I’m not seeing any signs of a “bubble” nor do I expect a nosedive. Why? I was a relatively new agent when the last bubble burst in 2005-2007. That bubble burst on the weight of high inventory (2-3x what we see today), a crashing economy w/high unemployment, and sub-prime/easy lending, none of which are seen in today’s market. I’m not concerned about a nosedive of 10% plus losses until we see unemployment go up quickly from 4-6% or listing inventory to go up 50-100% over current levels. I’m not afraid to tell my buyers it’s a good time to buy if you have a 5-year plan as buying now still looks better than renting for the next 5 years.
Since Q4 took a small dip and lost most of the 2018 gains, coupled with the recent drop in rates, I’m predicting a fairly early spring selling season that will bring 3-5% equity gains. I predict that inventory will grow the first 6-8 months and prices will peak in mid-summer with a similar drop-off at the end of the year as we saw this year. I believe we will see typical seasonal variations, but realize minimal equity growth of 0-3% by the end of the year. I’m expecting inventory to rise about 10-20%.
Despite inventory having risen this year (after 6 years of major drops), we still have relatively low inventory, an apparently good economy with very low unemployment, rising wages and no sub-prime mortgage mess. I don’t expect any “bubble” bursting.
Over the next couple years, we are likely to see a continued but evenly paced inventory climb. Lower priced “affordable” markets are still in high demand from locals staking their claim and investors alike. The “move-up” market is one of the stronger buyer segments now because they have equity, better job(s) and are simply staying in the market so the market doesn’t matter. We will start to notice a slight sell-off from those that are retiring, moving out of state, and from investors looking to offload rental property at their perceived market peak. This sell-off will likely come into play more notably this year.
Regarding loan rates, I think they will tick up slowly and end the year around 5.0 – 5.25%.
Want a free lunch?
If you got this far and read my entire article, please let me know what you think with an email/text/call. You’ve got a free lunch coming to you!
And thank you for your referrals – they are the foundation of my business at over 90% the last 5 years.
Adam Pascu
Broker / Owner
73 Degrees Realty
858-761-1707
ps. feel free to check out my San Diego Green Homes site if you have a passion for living green/sustainably and contact me (cell: 858-761-1707) for a free consult regarding how to green your home.