Here’s what I’m seeing from the 3rd quarter of 2018 in San Diego real estate, along with predictions for the rest of 2018…. Always hand-written with stats direct from our local MLS. Is this the end of an era, or Just a Correction?
2018 Q3 Summary
Sales Volume Down: Down 12% from Q2 2018. Down 12% from Q3 2017
Inventory RISING: up 9% from end of Q2 2018. Up 26% from Q3 2017
Loan Rates Up Again: Started at 4.65%, then went up t0 4.97%
Home Values Up: Median sales price up ~ 6% over Q3 2017
Govt./Policy Changes: Tax Reform Bill & Fed Fund Rate Increases
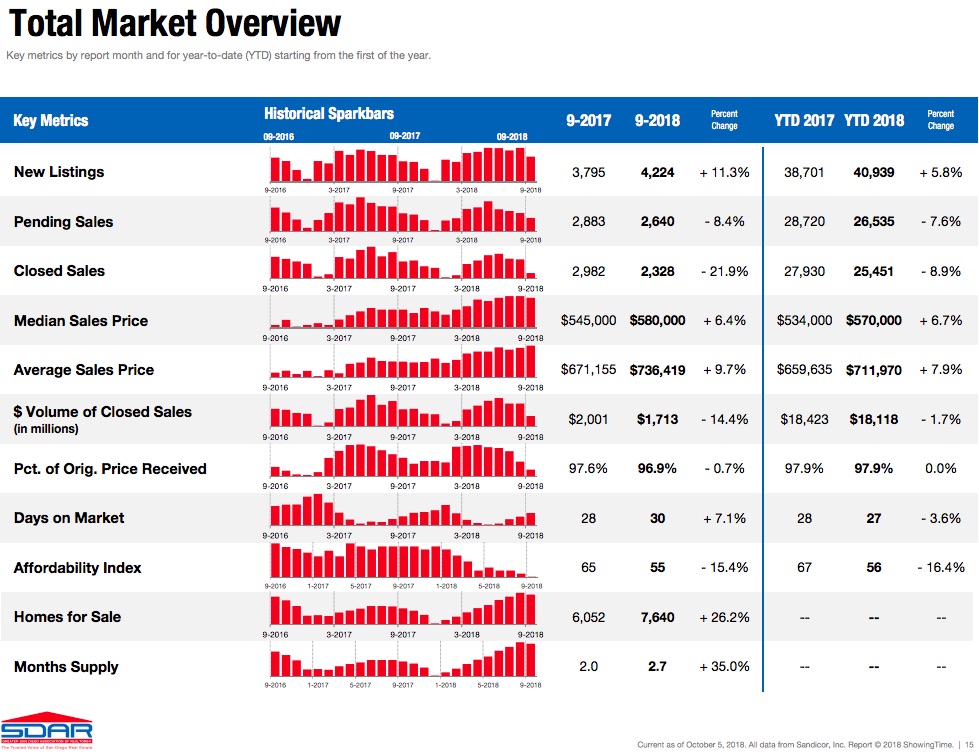
The Above image is a visual summary of my statistics reference from our local San Diego Association of Realtors.
Click here to View Full Stats from San Diego Association of Realtors
2018 Q3 – The Details
Sales Volume:
Sales Volume (# of total sales) has been going down for 3-4 years. However, that drop in sales used to be accompanied by a drop in inventory of total homes for sale. Thus prices continued to go up as the supply/demand curve was pointing up. Since the beginning of 2018, inventory has been increasing, but sales continue to trending downwards, in the opposite direction.
Sales Volume peaked in June and was dropping all of Q3 with a big drop-off at the end in September with September having 21.9% less sales in 2018 than in 2017. Will that trend continue or was September just a bad month?
While it’s normal for Q3 2018 to be about 12% lower than Q2, there is a bigger trend at work when we see that Q3 2018 had 12% less sales than 2017, despite having more inventory to choose from.
Inventory:
Inventory has been on the rise all year. It appears to have peaked in August, which is a bit late seasonally speaking. Total Inventory is up as a result of more new listings than last year, as well as fewer sales.
The inventory shift and pile up is much more noticeable in the attached housing section, the luxury market, and areas farther east/away from the city/coast. In comparing new listings in September 2017 to 2018, detached homes are up 21.3% and Attached Condos are up %39.4.
All that said, we need to remember that inventory is still near all-time lows and a shift towards more inventory is a good thing. But will inventory continue to rise as a trend or level off? Currently, we still have year-over-year gains of about 6%, so there has been enough demand this year to keep pushing prices up overall.
Loan Rates:
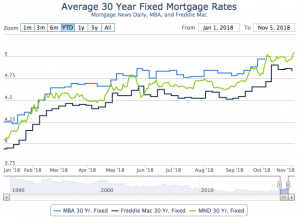
Rates started the year at 4.05% (MND average), steadily climbed in Q1 and have been slowly edging up the last 2 quarters to end at 4.97%. Rates have gone up by 15-20% this year alone. Perhaps we should not be surprised to see affordability hitting all-time lows. Homes at the same price cost 10-15% more/month than they did last year if you are financing 80% or more, which is most of the reason affordability is 15.5% lower than the same time last year (the 6% median home value increase being the other reason). Most lenders I’m speaking with are expecting rates to stay at this level and/or trend slightly up. Especially if we see more world stability accompanied by a rise in Stock prices. Typically, we see a run up at the end of the year, but I hope that doesn’t happen given the near 1% gain this year alone.
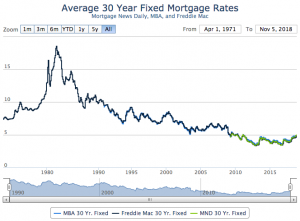
Home loan rate charts:
Long Term Rate Chart: 1971 – 2018 Short Term Rate Chart: 2018 weekly

Govt / Policy Changes:
The fed raised the Federal Funds Rate 3 times in 2017. This year, they raised it .25 in mid-March, .25 in June and again .25 in September. Most experts apparently expect them to raise it again in December as well as 3-4 times in 2019.
Continued federal fund rate hikes will raise the cost of Adjustable Rate Mortgages (ARM’s) often used on 2nd mortgages and Equity Lines, as well as credit cards and anything attached to the Prime Rate. I advise anyone sitting in an ARM or something attached to Prime to look into a fixed mortgage ASAP, unless you intend to sell in the next 1-2 years, or before your loan adjusts.
Tax reform is another big change just pushed through congress that everyone is currently speculating on. In San Diego, various pockets/price-points were effected more than others, but everyone in CA is generally a loser unless you had a direct benefit from the corporate tax cut. The lower prices (under $500k) appear to be less effected than the mid-upper range ($500k – $1.5mil).
Home Values:
We are still seeing year over year increases of about 6% year-over-year and are also at the end of the usual “up” season for the year. Currently, it appears that we peaked for the year 2 months ago in August, which is fairly normal. In the past few years, our “slow” season during the Q4 holiday season has not seen much of a price drop due to the incredibly low inventory and relatively strong demand. This year, we may experience a more notable seasonal pullback in prices.
What does the future hold? My predictions are below…
What’s next?:
It is my belief that the market is peaking and that we are seeing a correction brought upon by a quick rise in interest rates coupled with a negative tax bill for Californians and less demand for higher-priced real estate. While prices are still up, we continue to see opposing trends towards higher inventory, less sales/demand, and more new listings. Months Supply of Inventory is the best measure of supply/demand and that’s up from 1.9 months to 2.7 months, or 42.1%.
I’m expecting Q4 to take a small dip and lose most of the year’s gains. My last 2 buyers enjoyed a strong buying position and I can feel the market shifting.
Despite inventory having risen this year (after 6 years of major drops), we still have relatively low inventory, an apparently good economy with low unemployment and no sub-prime mortgage mess. I don’t expect any “bubble” bursting. A small correction or pull back, yes, but not a bubble-bursting.
Over the next couple years, we are likely to see a continued but evenly paced inventory climb. Lower priced “affordable” markets are still in high demand from locals staking their claim and investors alike. The “move-up” market is one of the stronger buyer segments now because they have equity, better job(s) and are simply staying in the market so the market doesn’t matter. We will start to notice a slight sell-off from those that are retiring, moving out of state, and from investors looking to offload rental property at the market peak. This sell-off will likely come into play more notably next year, but it is likely underway in conversations at dinner tables and in coffee shops with trusted Realtors.
I projected a 3-4% gain this spring in home values and 4-6% by end of year, but we’ve already seen 5-6% in the first three quarters of the year. I’m going to lower my estimate to 3-5% for the end of year as I’m expecting the market overall to do a small pullback (especially if rates rise any further) at year’s end. I predict that inventory levels will dip less than normal at the end the year and end at about 35-40% over last year’s numbers (which was an all-time low).
Regarding loan rates, I think they will tick up just a bit in Q4 and end the year around 5.25%.
Want a free lunch?
If you got this far and read my entire article, please let me know what you think with an email/text/call. You’ve got a free lunch coming to you!
And thank you for your referrals – they are the foundation of my business at over 90% the last 5 years.
Adam Pascu
Broker / Owner
73 Degrees Realty
858-761-1707
ps. feel free to check out my San Diego Green Homes site if you have a passion for living green/sustainably and contact me (cell: 858-761-1707) for a free consult regarding how to green your home.