2015 Q1 – Off to the Races Again!
Let me first summarize Q4 2014, which I didn’t do a full report on. Sales were pretty good for the 4th quarter, which is historically slow. Average 30-year fixed rates dropped from about 4.125 to 4.0. Inventory dropped consistently all quarter, which is normal, but with a late sell-off in December, inventory dropped to it’s lowest point in years at the end of the quarter (~4% lower than same time last year). Sale prices stayed relatively constant at about a 5% increase over previous year’s numbers. Heading into 2015 with the lowest inventory in years set the stage for an off to the races market again….
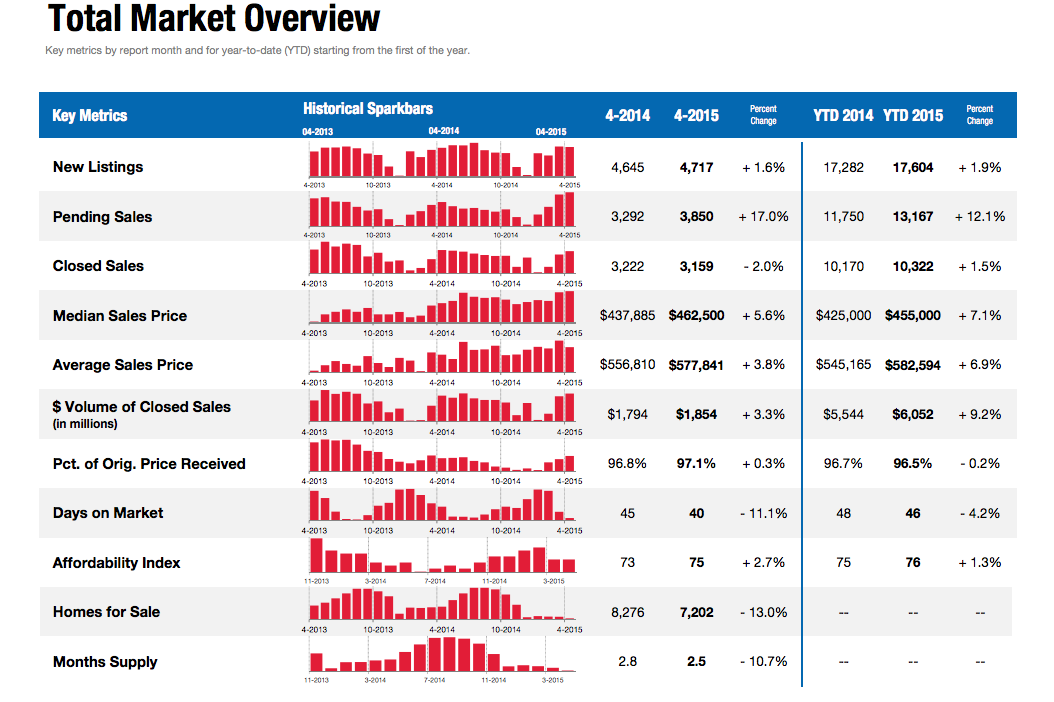
Q1 2015 Summary:
Sales Volume Steady: Down 10% from Q4. Up 3% from Q1 2014
Inventory at Record Lows: down 12% from Q4. Down 10% from Q1 2014
Loan Rates Dropped: The Benchmark 30-year fixed rate stayed around 3.75% all quarter
Home Values Up: Median sales prices up 2.5% from Q4. Up about 6-8% from Q1 2014.
Govt. Role: Fed Funds rate low/constant. Long-term effects of QE3 still in play.
Foreclosure/Short-Sale Activity Down: New filings & inventories down

The Above image is a visual summary of my statistics reference from our local San Diego Association of Realtors.
Click here to View Full Stats from San Diego Association of Realtors
2015 Q1 – The Details
Sales Volume:
Q4 ended with much anticipation among market followers as to what would happen in 2015. In the past few years, we have had big pushes in the early spring and this year is no different. If you looked at the Stats Link, you see that sales volume increased notably each month in the first quarter. And, with pending sales even higher in March, that tells us that Q2 is likely to have a high sales volume. Thus, Q1 has followed our typical seasonal trends as buyers continue to eat up everything that sellers put on market.
Inventory:
It is common for Q1 to start off with a low inventory after the previous year’s holiday season and this year was no exception. However, the typical seasonal norm of low inventory was highly pronounced as inventory was lower than we’ve seen in over 10 years. Moreover, demand is keeping up with the usual supply of new listings as inventory has stayed in virtually the same spot all quarter long, whereas the seasonal norm is for inventory to have risen by now. While I am encouraged to see seasonal norms moving the market pretty consistently over the last few years, the incredible lack of inventory can only effect prices in one direction as demand has outpaced supply.
Loan Rates:
Rates have leveled off after a very steady and slow decline over the last year. They stayed fairly level in Q1 hovering around 3.75% most of the quarter. Most economists expect rates to rise back up in the mid-term. The Fed is expected to continue to hold their recently purchased bonds & keep the Fed Fund rates low for the time being. (note: see Govt role below for more detail). Potential buyers are starting to get the word that rates have been dropping and I expect this should help push us through Q2 with relatively strong sales.
Their are multiple factors that I read in economic reports signaling an inevitable rise in rates, but when will this happen? There is the threat of inflation, rise in Fed Fund rates, and the govt selling off some of their bond assets, all of which will push home loan rates up. When this happens, be prepared for rates to go back to 5-6%. It could happen in 3 months or 2 years – your guess is probably as good as mine, but if you don’t think rates will go back up soon, talk to your parents and view the historical rates chart below…we are still hovering near all-time lows right now at about 3.75%.
Home loan rate charts: click the images to enlarge
Long Term Rate Chart: 1992 – 2015 Short Term Rate Chart: 2015 weekly


If your current rate is 4.625% or higher, then a refinance may be something to look into. Please send me a note or call your preferred lender if you already have one.
Home Values:
The median & average sale prices have gone up about 6-7% in the last year. That is a fairly level and healthy growth rate. For Q1 specifically prices took a big jump at the end of the quarter in response to a couple months of low supply and good demand. We had a small peak in pricing last spring in May and it appears we are on track for the same thing this year. We are only about 5% away from the peak of the market values from late 2005. What does the future hold? My predictions are below…
Government Role:
The Fed continues to keep the Federal Funds rate at .25%, which continues to spur economic growth. The Federal Government discontinued their stimulus bond buying program (aka QE3) last year. While the government has no plans to buy new bonds, it must be noted that they have no plans to sell the current inventory. Here’s a blurb from a Businessweek article that I think summarizes this well:
“Even after the purchases end, (quantitative easing’s) effects will persist. How could that be? The Fed will still own all those bonds it bought, and according to the agency itself, it’s the level of its holdings that affects the bond market, not the rate of addition to those holdings. Having reduced the supply of bonds available on the market, the Fed has raised their price. Yields (i.e. market interest rates) go down when prices go up. So the effect of quantitative easing is to lower interest rates for things Americans actually care about, such as 30-year fixed-rate mortgages.”
Thus, until the fed starts selling these bonds or raise the Fed Funds Rate, there will continue to be downward pressure on home loan rates due to government intervention.
Foreclosure Trends:
If it gives you any indication of where the foreclosure & short-sale market is at, I will be deleting this item from my market updates in the near future. With prices approaching the peaks seen in 2005, foreclosure & short-sale inventories are down to low levels. They simply aren’t a major market factor anymore. Specifically, inventories and new filings have continued a slow decrease. You can view the full stats at my favorite foreclosure site:
San Diego Foreclosure Stats
California Foreclosure Stats
What’s next?:
While it’s not that hard to predict the short-term if you have the correct statistics at hand, mid & long-term economic trends are quite elusive and usually prove me wrong. As a real estate broker, I am entrenched on the front lines of the current local market, but don’t have the knowledge or time to follow macro-economics at a national or international level. As such, I don’t make predictions past the short-term and do not advise you to make financial decisions based on my predictions.
Currently, San Diego inventory remains extremely low and has been following typical seasonal trends for almost 3 years now. Rates have dropped to their lowest levels of the past year and demand has picked up and is outpacing supply, so there is only one thing to predict in Q2. We are right in the middle of a pricing increase, which I expect to continue through the end of Q2.
It is my guess that rates will remain relatively level or slightly up in the next 3 months, but I do expect rates to increase relatively soon thereafter. My best guess is that we will see a moderate gain in home values over the next 3 months. How much? I expect moderate increases in the near-term, so a 2-3% increase in Q2 sounds very reasonable to me. Depending on how much of a spike we see in Q2, it is possible that Q3 & Q4 will be pretty level or have a slight pullback if the Q2 spike is high. It is my feeling that we are where we should be now regarding home values and that we should start seeing the typical healthy 4%/year growth which is the San Diego average over the last 50 years.
Guest Blog: 3 Tips to Save Big on Solar in San Diego
Going Solar does not have to be a difficult or overwhelming process. Here are 3 tips to save you time and money this summer going solar in San Diego.
- Talk to 3 contractors. Talk to a local contractor, a National Chain, and a referral from a neighbor or friend to get a good price spectrum.
- Buying Solar is much more attractive long term, and will actually help you sell your home as opposed to leasing. There are plenty of $0 down financing options with more attractive payments than solar leases as well.
- Check your bids or solicit bids hassle free on BeatMySolarBid.com. Get high quality, pre-screened contractor bids emailed to you within 24 hours without having an in home visit.
Read the full article here or visit Beatmysolarbid.com.
Thank you for reading – I appreciate your time as well as your comments. Here are a couple additional resources if you are thinking about buying, selling or just curious about your home’s value:
And thank you for your referrals – they are the foundation of my business at over 90% the last couple years.
Adam Pascu
Broker / Owner
73 Degrees Realty
858-761-1707
ps. feel free to check out my San Diego Green Homes site if you have a passion for living green and contact me (cell: 858-761-1707) for a free consult regarding how to green your home.