2015 Q3 – A Hot and Finicky Market
Q3 2015 Summary:
Sales Volume Up: Down 11% from Q2. Up 9% from Q3 2014
Inventory at Record Lows: Down 8% from Q2. Down 23% from Q3 2014
Loan Rates Down: The Benchmark 30-year fixed rate dropped about 0.25% & ended at 3.89%
Home Values Up: Average Median sales price up 1.5% from Q2. Up ~6% from Q3 2014.
Govt. Role: Fed Funds rate low/constant. Long-term effects of QE3 still in play.
Foreclosure/Short-Sale Activity Down: New filings & inventories down

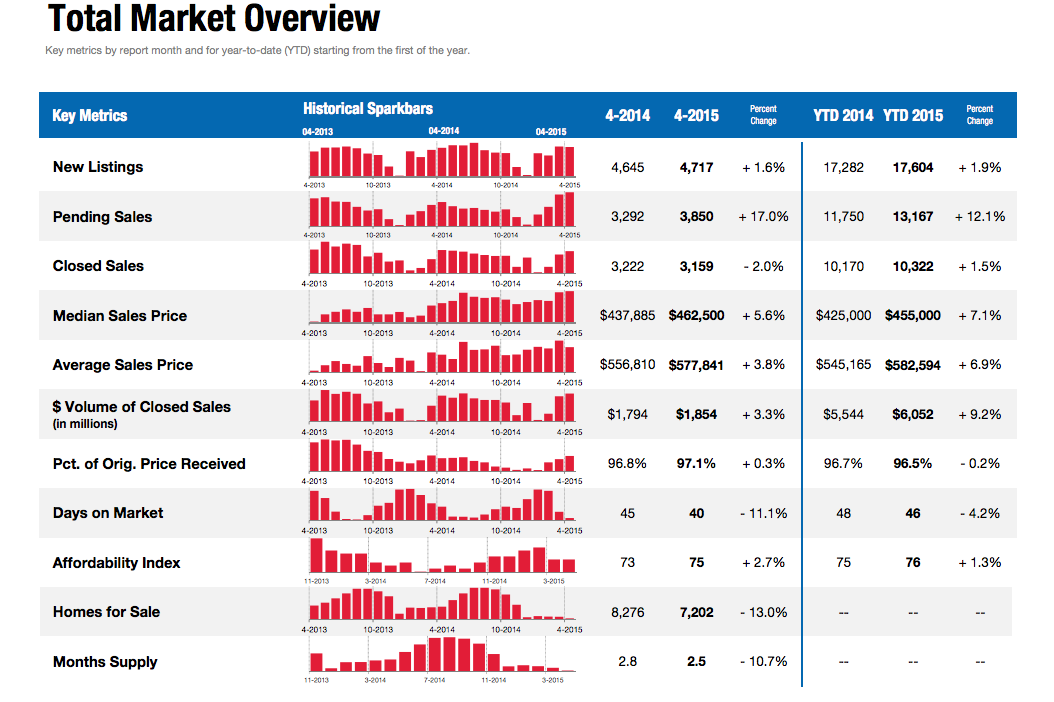
The Above image is a visual summary of my statistics reference from our local San Diego Association of Realtors.
Click here to View Full Stats from San Diego Association of Realtors
2015 Q3 – The Details
Sales Volume:
Q2 was a red hot market that carried over into Q3, but then tapered off. That said, a tapering of sales volume in the fall months is a common seasonal trend. It’s possible sales volume would have been higher if there were more homes for sale – the common theme this year has been an extremely low inventory/supply of homes for sale. Seasonally, it was a strong 3rd quarter with sales volume being about 9% higher than Q3 of 2014. Pending sales from october indicate a slow decline in sales is ahead for Q4 which is common. Thus, although Q3 sales volume is following the typical seasonal down trend, we surpassed typical seasonal Sales Volume from recent years making it a strong Q3.
Inventory:
It is plain to see from the image above that inventory (“homes for sale”) as a whole has been extremely low this year. The typical seasonal norm is that inventory starts climbing slowly throughout the year until it peaks in the early fall, which is what we experienced this year. However, with very low inventory and a pronounced drop in new listings month over month in Q3, the peak was at the very beginning of the quarter. We experienced a notable downtrend in inventory during Q3, which we usually start seeing at the beginning of the 4th quarter. Thus, inventory was extremely low from a seasonal perspective, being 23% lower than Q3 of 2014. The low inventory has dominated conversations around the real estate campfire this year – buyers and Realtors alike are hoping for more inventory next year, while sellers/homeowners reap the benefits.
With sales/demand good and inventory/supply low, you don’t need an advanced economics degree to know that there is upward pressure on prices. The “Months Supply of Inventory” is the statistical representation of the supply demand curve and it is at it’s lowest point in years.
Loan Rates:
Rates started Q3 at yearly highs around 4.20 after a fairly steady rate hike during Q2. But out of the gates, rates declined about 0.25% in July and stayed relatively flat the rest of the quarter. The low rates continue to fuel buyer demand as most expect a rate hike to happen in the near future and everyone sees the benefit in sub 4% home loan rates.
So when will rates go back up and how high?? It could happen in 3 months or 3 years – we could see a modest increase to 5% or a more dramatic change to 6% – your guess is probably as good as mine, but if you don’t think rates will go back up soon, talk to your parents and view the historical rates chart below…we are still hovering near all-time lows right now at about 3.90%.
Home loan rate charts: click the images to enlarge
Long Term Rate Chart: 1992 – 2015 Short Term Rate Chart: 2015 weekly


Home Values:
The median & average sale prices have gone up about 6% and 3% respectively over Q3 of last year. I place more value on the median than the average. That is a fairly level and healthy growth rate. For Q3 specifically, median prices started at their high point for the year in July and then dropped in August & September. Considering most of our yearly equity gain was realized in Q2, a slight pullback is not a surprise. As noted above, the supply/demand curve is still pointing towards more equity growth. We are very near pricing from the peak of the market values from late 2005. What does the future hold? My predictions are below…
Government Role:
The Fed was expected by many to raise the Fed Funds rate at their September meeting but a vote of 9 to 1 kept the rate at .25%. This continues to spur economic growth, but the Fed expects to raise the Funds Rate by end of 2015. The Federal Government discontinued their stimulus bond buying program (aka QE3) last year. While the government has no plans to buy new bonds, it must be noted that they have no plans to sell the current inventory. Here’s a blurb from a Businessweek article that I think summarizes this well:
“Even after the purchases end, (quantitative easing’s) effects will persist. How could that be? The Fed will still own all those bonds it bought, and according to the agency itself, it’s the level of its holdings that affects the bond market, not the rate of addition to those holdings. Having reduced the supply of bonds available on the market, the Fed has raised their price. Yields (i.e. market interest rates) go down when prices go up. So the effect of quantitative easing is to lower interest rates for things Americans actually care about, such as 30-year fixed-rate mortgages.”
Thus, until the fed starts selling these bonds or raise the Fed Funds Rate, there will continue to be downward pressure on home loan rates due to government intervention.
Foreclosure Trends:
I will be deleting this item from my market updates at the end of this year. With prices approaching the peaks seen in 2005, foreclosure & short-sale inventories are down to low levels and aren’t a notable market factor anymore. You can view the full stats at my favorite foreclosure site:
San Diego Foreclosure Stats
California Foreclosure Stats
What’s next?:
While it’s not that hard to predict the short-term if you have the correct statistics at hand, mid & long-term economic trends are quite elusive and usually prove me wrong. As a real estate broker, I am entrenched on the front lines of the current local market, but don’t have the knowledge or time to follow macro-economics. As such, I don’t make predictions past the short-term and do not advise you to make financial decisions based on my predictions. That said….
Currently, San Diego inventory remains extremely low and rates moved a bit downward, both of which place upward pressure on the market. We had a huge boost of sales/pricing in Q2, which culminated in a slight pullback at the end of Q3. Q4 has felt busy for me with decent sales activity across the board
It is my guess that rates will remain relatively level the next 3 months. My best guess is that Q4 home values will be relatively stable and that we will end the year with record low inventory. That will set the stage for a roaring 2016, and likely, another 4-6% bump in home values in 2016.
Thank you for reading – I appreciate your time as well as your comments. Here are a couple additional resources if you are thinking about buying, selling or just curious about your home’s value:
And thank you for your referrals – they are the foundation of my business at over 90% the last 3 years.
Adam Pascu
Broker / Owner
73 Degrees Realty
858-761-1707
ps. feel free to check out my San Diego Green Homes site if you have a passion for living green/sustainably and contact me (cell: 858-761-1707) for a free consult regarding how to green your home.